“Consistent” technique is generally considered to be a quality of high-level weightlifter. However this is a qualitative term and therefore its difficult to objectively measure or target for improvement. So this brings up the questions: How exactly do we define consistency? And can we quantify it?
Before we can quantify “consistency”, we have to define it more specifically and there are a few potential strategies that we could use.
- Option 1: The proportion of lifts an athlete makes above a certain threshold. For example 90%+ of their 1 rep max. This method may be particularly useful in the lead up to a meet when you need to be confident the athlete can hit these weights but it may be less relevant in a long-term program.
- Option 2: The ability for the athlete to lift heavy weights with the same technique as lighter weights. This method is interesting and could be relevant when evaluating how technique development translates to heavier loads.
- Option 3: The ability for an athlete to lift a moderate weight the same way over multiple lifts. This approach is the closest to pure repeatability.
All of these methods could be valid and the specific definition of consistency most useful may depend on the needs of athlete or the interests of the coach. For the purpose of choosing a place to start, I decided to try Option 3 and attempt to quantify lift consistency as the variance in the technique of an athlete lifting a moderately heaving weight over a series of single lifts.
Test Procedure
To accomplish this goal, I defined the test as 1 snatch at 80% of the athlete’s 1RM, every 90 seconds, for a total of 10 reps. The metric for consistency would then be based of the variance between these 10 lifts. (Note: Throughout this article when I reference “variance”, I am referring to how much the lifts vary and not calculated statistical variance.)
Ideally I would track the absolute bar path of the lift as well as the orientation of the athlete’s body segments or joint angles. Eventually I would like to go this route, however bar path requires a well placed camera to get accurate data and it is difficult make this a repeatable test. Additionally segment or joint data may just result in informational over-load at the beginning.
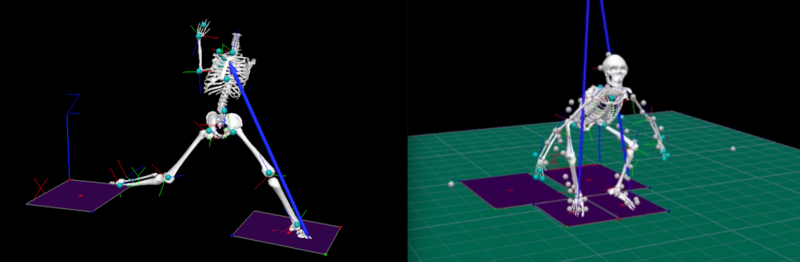
Instead I decided to start with the more minimal approach and track the vertical and horizontal acceleration of the barbell from lift-off to the end of the second pull using an accelerometer built into a barbell collar. The barbell acceleration profile is useful because it directly influences bar path and is a much easier method to collect repeatable test data at a high sample rate (90 Hz in this case). For this experiment, I used the barbell collar accelerometer I built, pictured below, that is explained more here.

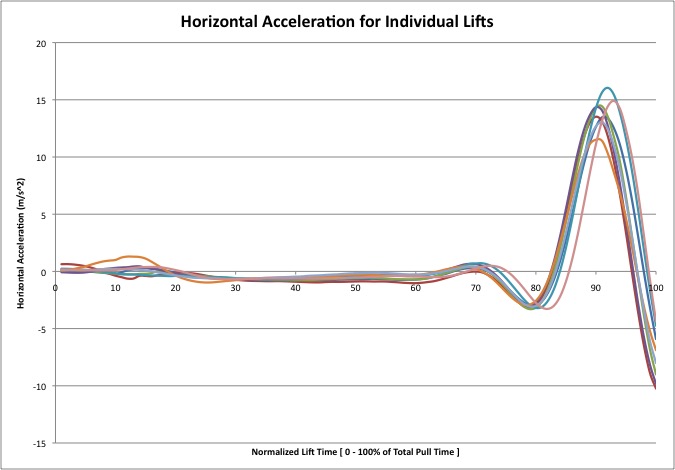
For this case study, I used myself as the test subject and executed all snatches at 100 kg (220 lbs), which is approximately 80% of my maximum of 126 kg (278 lbs). Two of the trials had an error in the data so I ended up with 8 good trials to use. All trials were analyzed using a script written in Matlab and time-normalized for 0 to 100% of the total time to reach maximum vertical bar velocity. The acceleration profiles for the horizontal and vertical directions of all the lifts are shown in the figures below (Figure 1 and 2).

Consistency Analysis
To analyze the variance between the lifts I choose to take the average and standard deviation of each normalized time point over the 8 trials. The results are shown in the graphs below (Figure 3 and 4). The solid line represents the average acceleration and the error bars are equal to the standard deviation at each point.
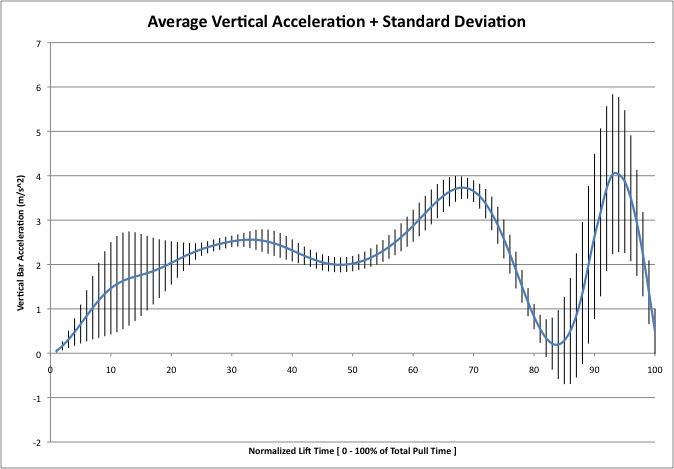

The error bars on graphs of the average accelerations make it fairly easy to visualize the variance between the lifts. The larger the error bars, the greater the barbell acceleration varied between the lifts at that point in time. In general there was a much greater variance in the vertical acceleration in large part because the majority of the motion is in the vertical direction.
The two times of the lift that varied the most, in both vertical and horizontal directions, were immediately after lift-off (0-20% of the lift) and during the second pull (80-100% of the lift).
Consistent movement patterns during the first pull are important to set-up the athlete for the rest of the lift. Ideally the patterns of acceleration for both directions would be much tighter. Since this section occurs at the beginning of the lift, it can be easily targeted form improvement through repetition and practice of the 1st pull.
Consistency in the second pull is more difficult to improve since this phase often compensates for the acceleration profile earlier in the pull. For example, some of the lifts with the lowest vertical barbell acceleration during the second pull also had some of the highest acceleration values earlier, and thus, the bar already had sufficient velocity. Most likely, improved consistency earlier in the lift will have a down-stream effect and improve the variance of the second pull as well.
Variance between trials in the horizontal direction may also be highly trainable as this is when an athlete might “push” the bar away from their body instead of having a vertical bar trajectory. An outward or loopy bar path is common fault for me so I’m not surprised that the peak horizontal acceleration was as high as it was. Ideally with focused training I could consistently bring that peak value down.
Given that this experiment used only 1 subject, it was a pilot analysis at best. However, the graphs above do appear to give some interesting information, and thus the experiment served its purpose to warrant more investigation.
There are multiple ways that this data could’ve been analyzed including looking at the differences of the time when key events occur during the pull and the magnitude of those events. That method might be something I explore in the future but for now the graphical analysis allows for a relatively quick and easy understanding of the results and will also allow for a simple comparison to future tests using the same procedure.
This visual method could easily be converted to a quantifiable number and tracked by recording the size of the error bars on the graph of the average accelerations (Reminder: The error bars were calculated as the standard deviation of the data at that point in time). Values we might be interested in include the maximum variation over the lift, the variation at key points, the sum of all variation over the lift, or the average variation during a specific portion of the lift.
Is this important?
Maybe or maybe not. The first step to find out is to collect more data from athletes of various skill levels and compare the results. If there is no difference between the groups then it is probably not a good metric, but if higher-level athletes have quantifiably less variance between lifts based on this method, then it may be valid and useful.
This experiment was driven by my general interest in trying to quantify typically qualitative data. However a valid “consistency” metric could provide an objective data point to help develop lifters, identify weaknesses, and create targeted programs.
