Can we predict the success of a starting pitcher with machine learning using Statcast pitching data?
Introduction:
This analysis is intended to expand upon a scientific paper titled “Ball Speed and Release Consistency Predict Pitching Success in Major League Baseball” by Whiteside et al.
Whiteside analyzed in-game pitch data available from MLB Statcast. The study utilized a regression analysis to determine the variables that contributed to the success of a Major League pitcher. The “success” of the pitcher was determined by the “Fielding Independent Pitching” statistic (FIP). Essentially it is intended to be comparable to ERA but independent of team defense. The study found Velocity and release consistency to be significant contributors to a better FIP, however these variables only account for 22% of the statistical variance. In other terms, 78% of a pitcher’s FIP is determined by something else.
The purpose of this analysis was to take a slightly different approach and use the data collectively with a machine learning algorithm to try to predict if a pitcher would be an elite, average, or a poor starting pitcher based on the performance characteristics of their pitches (their so-called “stuff”). With the advent of new sports technology, these characteristics can easily be captured during training or games using PITCHf/x or Rapsodo systems. Therefore it could give teams an additional tool to project a prospect’s performance before they debut in the Major Leagues.
Procedure:
Pitch data was obtained from Baseball Savant for all starting pitchers from the 2016 season. The data was processed and analyzed using Python scripts that can be found on my Github.
Based on the protocol from Whiteside’s paper, only fastballs, curveballs, sliders, and change-ups were analyzed. This was done because only characteristics of the same pitch type can be directly compared. The data was filtered to include only pitchers who threw greater than 50 of each pitch over the season. Ultimately 59 pitchers were included in this analysis.
The following variables were recorded or calculated from the downloaded Statcast data for each of the four pitches.
- Pitch frequency (Proportion of each pitch thrown)
- Average pitch velocity
- Average pitch horizontal movement
- Average pitch vertical movement
- Average horizontal release location
- Average vertical release location
- Average release location 2D vector
- Pitch velocity variability
- Horizontal movement variability
- Vertical movement variability
- Release location 2D vector variability
- Release location ellipse area (Based on 90% confidence intervals of the vertical and horizontal release location variability)

The FIP of each pitcher was ranked in order of lowest to highest (best to worst). The top 25% of pitchers were considered top-level pitchers, the next 50% of pitchers were considered mid-level pitchers, and the bottom 25% were considered low-level pitchers. Categories were give the discrete values to be used the prediction algorithm [Top-level = 0, Mid-level = 1, Low-level = 2].
The data was “learned” using a neural network (multilayer perceptron) from the scikit -learn toolbox in Python.
The pitchers were randomly split into groups with 75% of the subjects placed in the “training group” and 25% of the subjects placed in the “test group”. The training group data was used along with the performance category of each pitcher to “teach” the model any potential associations between the data and the performance outcomes. The model was then tested by giving it the “test data” which it used to return its prediction for the performance category the pitcher would fall into. The model’s predictions and the actual performance category for each pitcher in the test group were compared to score the model’s performance.
The model was tested with multiple weighting factors to find the settings with the best performance. Additionally 5 trials were run with different randomization factors, to see how variation in the randomization affected the results.
Results:
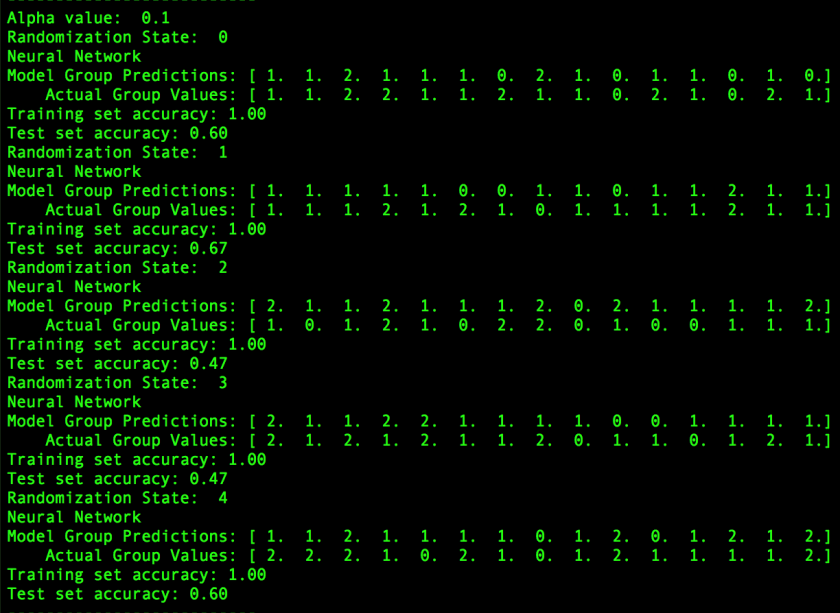
The output from the machine-learning model with the best performance is shown below. The average performance of the model over the 5 trials (with different subject randomization) was 56.2% correct responses.
Discussion:
So can we predict pitcher performance based on the characteristics of their pitches?
Maybe… But we certainly need more data to do it well.
The training set accuracy (accuracy of predictions if we run the training data set back through the model) was 100%, indicating that it is possible to learn this data. However the model only had moderate success generalizing predictions to data it has never seen before. Indeed, the vast majority of the correct predictions by the model were for 1’s which is the middle 50% of pitchers. Statistically speaking, if the model guess 1 for every point, it’s accuracy would average 50%, so our model only performed slightly better than this case.
There was also a large variation between trials based on the randomization. If the data pool is sufficiently large, this should not be an issue but it was a significant factor particularly for a couple of the trials when most of the 0’s or 2’s ended up in one group or the other. Predicting pitchers who be elite (or poor) would certainly give the most value, however, this model only had limited success for those pitchers. Ultimately a training group of 44 pitchers and a test group of 15 pitchers simply isn’t enough data to solve this problem. Expanding the analysis to multiple seasons or changing the selection criteria would increase the amount of data available and might yield better prediction results.
Opportunities to improve this model and analysis in the future:
- More data. More pitchers over more seasons.
- Add additional pitching characteristics such as accuracy, pitch location, fastball/offspeed velocity difference, changes in pitching over the course of the game, etc….
- Change pitcher selection criteria and analysis to account for pitchers who throw different repertoires of pitches.
Additional References:
Baseballsavant.com
“Introduction to Machine Learning with Python” by Sarah Guido and Andreas Muller
